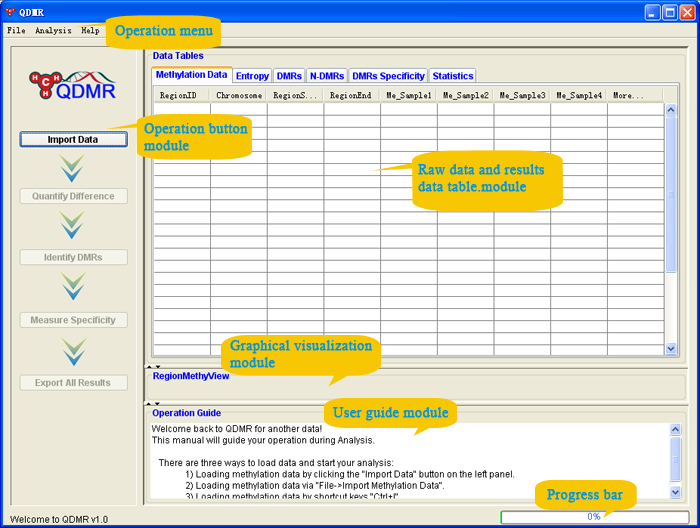
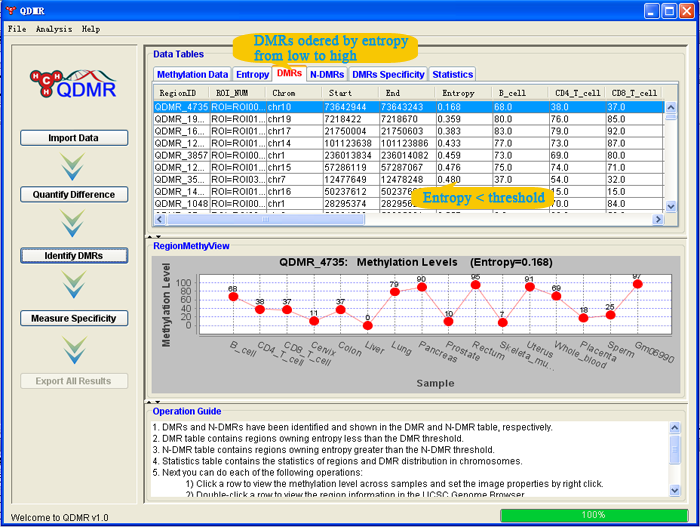
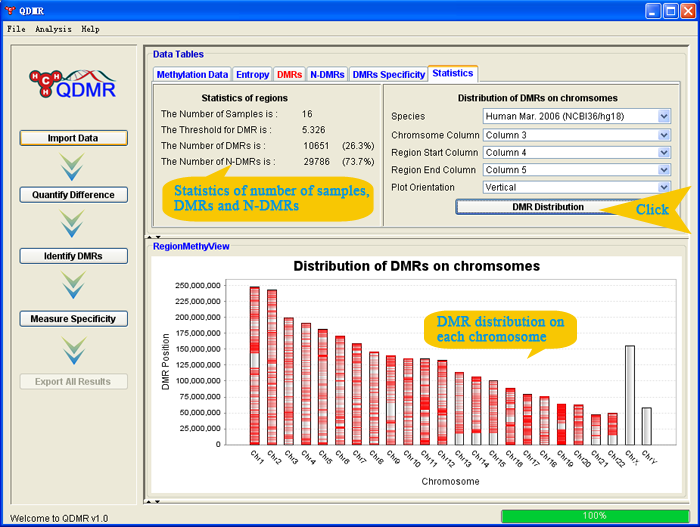
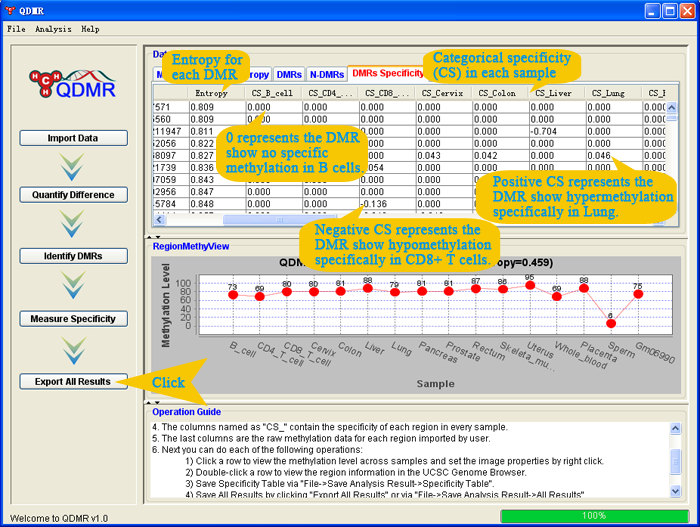
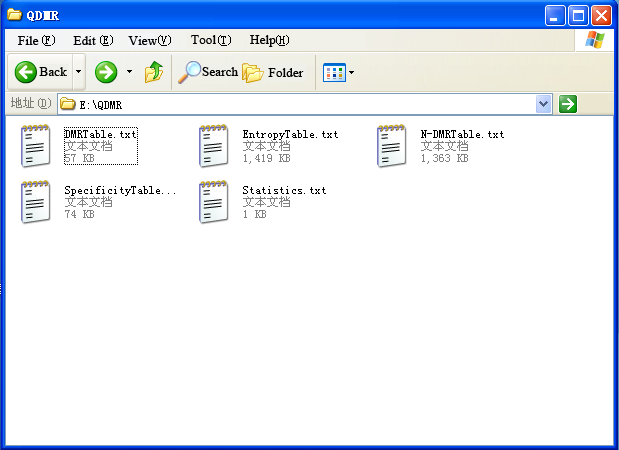
There are three ways to load data and start your analysis:
| |
1) |
Loading methylation data by clicking the "Import Data" button on the left panel. |
| |
2) |
Loading methylation data via "File->Import Methylation Data". |
| |
3) |
Loading methylation data by shortcut keys "Ctrl+I". |
QDMR provides the visual interface to import data.
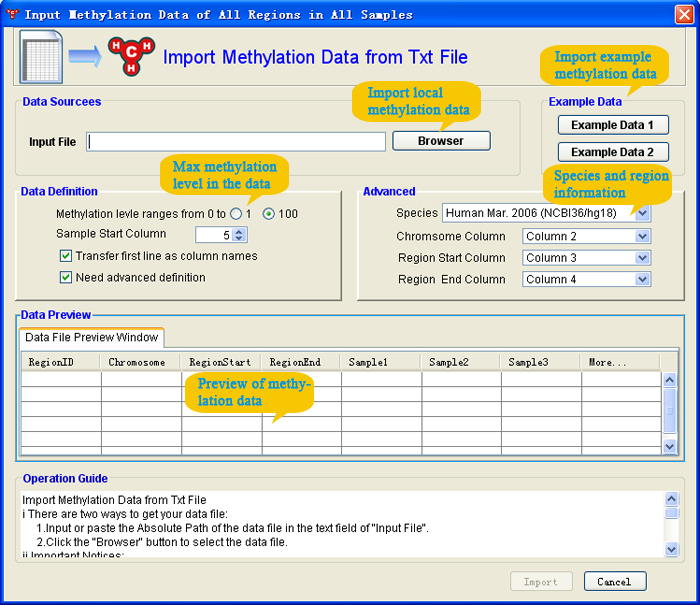
Before import data, please make sure that the data is save in txt file as the format as shown in this example data:
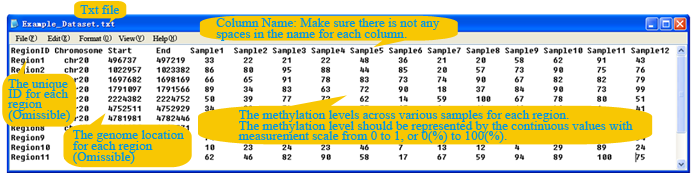
Now Import Methylation Data from Txt File:
i There are two ways to get your data file:
1.Input or paste the Absolute Path of the data file in the text field of "Input File".
2.Click the "Browser" button to select the data file.
ii Important Notices:
1.It is suggested to refer the exemple data by click the "Exemple Data 1 or 2" button before import your own data.
2.Information about the regions of interest should be before the methylation data for the region.
3.You can tune the start column of methylation data.
4.Select the Check Box named "Transfer first row as column names" if you want column names as your first row.
5.Column names will be generated automatically if you don't check the box named "Transfer first row as column names".
6.Be sure that methylation value should be in the rage of 0 to max value(1 or 100) according to your methylation data.
7.You must ensure that there are no missing values in your data.
6.The first 20 rows of data will be shown in the data file preview window as any change take places.
After confirmation, click Import button to import data. The following interface will be shown a little while.
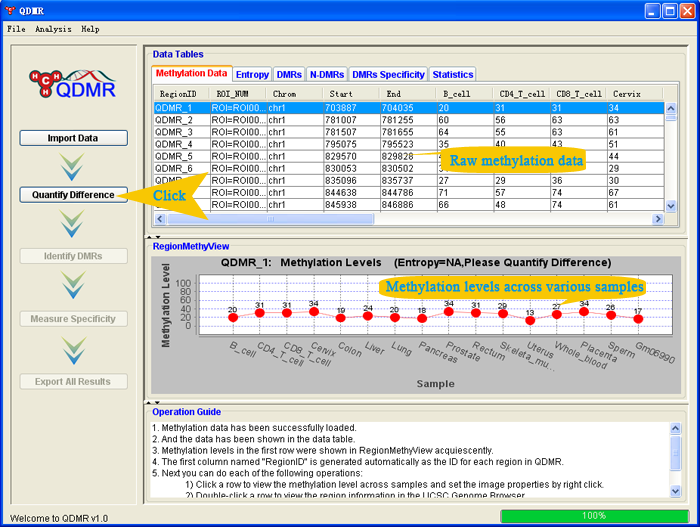
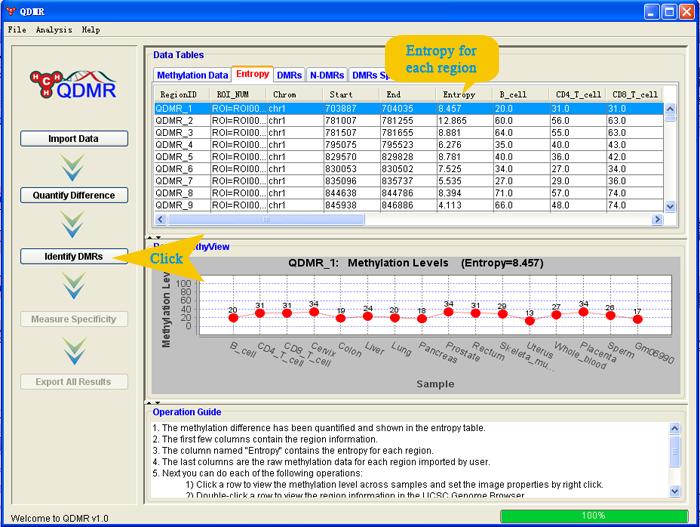
Methylation data has been successfully loaded and shown in the data table. The first column named "RegionID" is generated automatically as the ID for each region in QDMR.
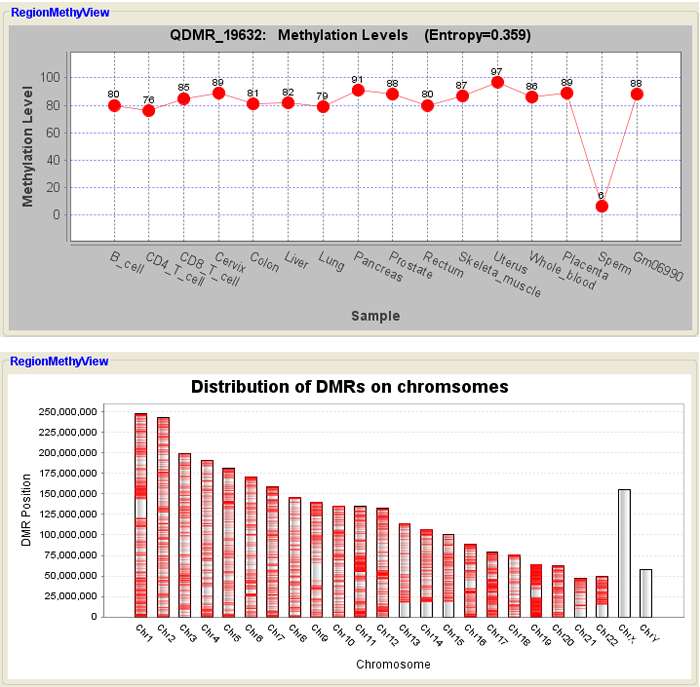
Methylation levels in the first row were shown in RegionMethyView acquiescently.
Next you can do each of the following operations:
| |
1) |
Click a row to view the methylation level across samples and set the image properties by right click. |
| |
2) |
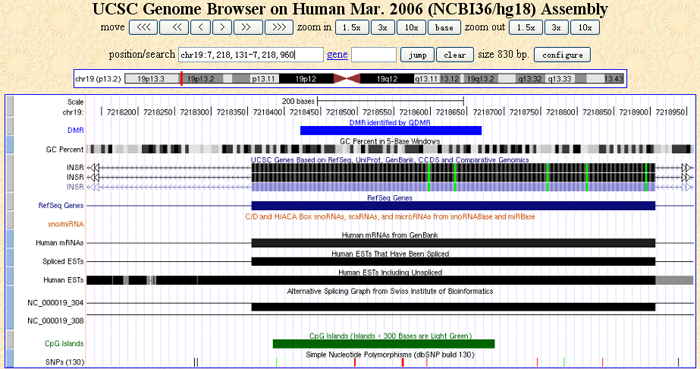
Double-click a row to view the region information in the UCSC Genome Browser. |
| |
3) |
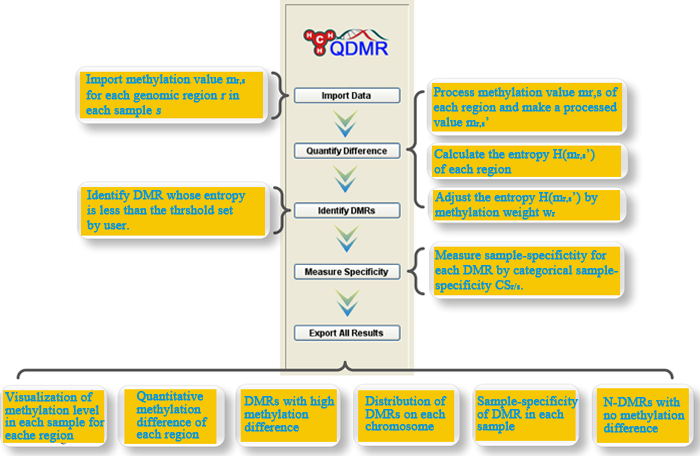
Click "Quantify Difference" button to quantify methylation difference by canculating entropy for all regions. |
|