LocusZoom.js
A Javascript/d3 embeddable plugin for interactively visualizing and navigating statistical genetic data from customizable sources.
Try LocusZoom.js
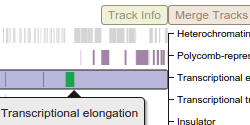
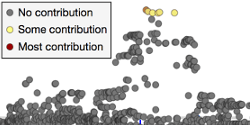
Shown here is a standard interactive LocusZoom plot, depicting GWAS association data with gene tracks loaded from a University of Michigan API. Change the region of the genome in view by scrolling to zoom or dragging to pan, or use some of the links below to jump to top hits for this study by gene. Click around and experiment... LocusZoom.js can do a lot.
Top Hits
To see other forms of LocusZoom.js in action take a look at locuszoom.org or the examples on this page.
Get LocusZoom.js

To use LocusZoom.js in your application you will need both LocusZoom's compiled Javascript and CSS and two third-party Javascript libraries (available here in a single vendor bundle). We recommend the CDN links below. If you prefer, you may also install the package via NPM and use with any module system that supports UMD modules. Source maps are provided for all files.
CSS
All CSS classes are namespaced to avoid collisions
Dependencies
To download or link to past builds of LocusZoom.js use the URL structure above and the version number of your choice. A complete list of past releases can be seen here.
Download Full Source (Latest Version)
Documentation and Support
Complete LocusZoom.js API DocumentationLocusZoom Message Board
Example Plots
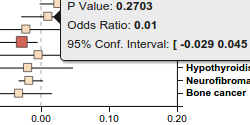
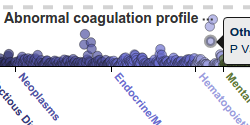
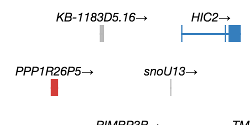
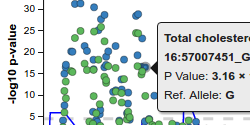
LocusZoom.js is customizable, extensible, and highly flexible. It can work with a wide variety of different types of data. Below are some examples to show some of LocusZoom.js's variability.